Earth's Greenhouse Effect Revisited: Blackbody Radiation, Greenhouse Effect, and Climate Change
Last several classes Merck walked you though the basics of climate. Today we'll examine changes in climate, and what factors
produce these changes (particularly on the shorter time scales of centuries, decades, and years.)
|
In physics one can calculate the blackbody radiation for any object being illuminated by another source. We won't
go through the full equation here (it is called the Stefan-Boltzmann law, and you can see it worked out
here). The estimation is that Earth's blackbody
temperature should be 255 K (that is, -18°C). However, the observational data shows Earth's actual average
surface temperature is 15°C, 33K warmer than its blackbody temperature.
(An aside: the Moon--which of course is in the same orbit around the Sun as is the Earth, has an actual surface temperature of -23°C, as predicted by the blackbody equation. [Its smaller area results in it capturing much less energy from the Sun than does the Earth.] The Moon lacks any atmosphere to speak of, so it is a pretty good blackbody.) In the mid-1800s Irish scientist John Tyndall discovered that carbon dioxide, water vapor, and various other gases served to trap the IR radiating from the Earth's surface, and thus discovered why the Earth is 33K warmer than predicted. We now know in far greater detail both the composition of the atmosphere and the way its different components absorb different parts of the electromagnetic spectrum (see figure on right: compare the downgoing solar radiation [red] and upgoing thermal radiation [blue] to the different grey portions of the spectra below.) |
|
Tyndall further suggested that changes in atmospheric composition over geologic time may have resulted in differing climate conditions at different periods of time: the swamps of the Carboniferous Period versus glacial conditions of the Pleistocene.
In the early 20th Century Swedish scientist Svante Arrhenius predicted that human activities (primarily the burning of coal for industry and heating) had the potential to raise atmospheric carbon dioxide levels high enough to have a noticeable effect on climate. (In his opinion, this was primarily a good thing, as cold regions like Scandinavia would become more like France and Spain.)
Radiative Forcings:
|
Throughout the 20th Century climatologists identified the major components of climate, and recognized that these
could all change through time (and thus change climates.) Eventually an attempt was begun to standardize their
relative contribution to climate.
The concept that was developed was called radiative forcing. Its formal definition is (in full):
|

|
We are going to move on to look at some of these different radiative forcings in detail, but one critical issue to deal with first. This is not a scientific one, but a social one. You will often hear those who deny the scientific understanding of anthropogenic climate change pretend that actual climate researchers think the whole issue is just greenhouse gases. NOTHING COULD BE FURTHER FROM THE TRUTH! Hopefully the lectures and readings are showing you that climatology involves interactions between many spheres of Earth's systems in different ways. However, the concern about the contribution of human greenhouse gases is that they represent a major new flux into the atmosphere not otherwise taken up by an equivalent new flux out of the atmosphere.
By the way, here is the averaged planetary temperature during the instrumental record (basically 1880 onwards),
from the Goddard Institute of Space Studies:

Natural Sources and Sinks for Atmospheric Carbon Dioxide (and other Greenhouse Gases):
|
First, a note why carbon dioxide is the greenhouse gas of greatest concern, even though methane and water vapor
are both more effective at trapping heat. It mostly hinges on residence time. Tropospheric water vapor only
hangs around for a mere nine days or so; methane 12±3 years; and carbon dioxide tens of thousands of years.
(To make matters worse, methane is normally lost from the atmosphere by reactions that produce atmospheric carbon dioxide!)
There are many natural sources and sinks for greenhouse gases, and it is important to recognize these in order to understand climates and climate changes. We'll review some of the key ones, by considering which spheres are involved in the interaction. Let's take a look at the carbon cycle as a reminder (see plot on right.) As is fairly clear, the biospheric-atmospheric interactions are the largest component (hence the annual cyclicity of the Keeling Curve, for instance.) These are driven by a pair of complementary chemical reactions: photosynthesis and heterotrophic respiration. Plants take in sunlight, carbon dioxide, and water to produce carbohydrates and waste oxygen; heterotrophs oxidize carbohydrates to produce energy and release waste water and carbon dioxide. The living world also is a major contributor to water vapor (we'll see this in a bit) and interacts with the lithosphere as well. Back to the atmosphere, though: the shallow ocean-atmosphere interaction is by far the largest in the system except for the living world. How exactly does carbon dioxide get into the oceans? |

|
There are three main processes by which carbon enters the ocean:
- The Biological Pump: just as on land, photosynthesizers (phytoplankton and other algae) take in carbon dioxide to produce their tissues. They are then eaten by other organisms, which may be eaten by other organisms, and so on. Some sizable fraction of this material winds up as fecal material, a fraction of which makes it to the deep ocean where it is sequestered for fairly long periods of time.
- The Carbonate Pump: many organisms make shells of calcium carbonate (CaCO3). They take up calcium and bicarbonate ions (the latter having entered the oceans by lithosphere-atmosphere-hydrosphere interactions below: see, we TOLD you these are all interrelated!!) to form calcium carbonate and waste carbon dioxide and water. Those shells can be sequestered (as complete shells or as broken up fragments) on the sea floor (and perhaps, eventually, as limestone) for very long periods of time. Note: the carbonate pump releases one carbon dioxide molecule for each carbon atom sequestered in shell form. You win some; you lose some...
- The Solubility Pump: carbon dioxide can also be absorbed directly by water. As mentioned previously, colder and more pressurized water can hold more dissolved gases. Where NADW and AABW form a huge amount of carbon dioxide gets moved into longer-term storage.
The vast majority of Earth's carbon is stored in the lithosphere, but is not easily accessible to the other spheres (at least not during normal processes.) Thus, the flux rates are fairly low. There are two main lithospheric-atmospheric processes to deal with: volcanoes and chemical weathering.
Volcanoes represent a very rapid means by which greenhouse gases (carbon dioxide, methane, water vapor) can be relased from the lithosphere into the atmosphere. At some points in Earth's history (we'll get to these later in the semester) there have been releases of greenhouse gases that dwarf what we could possibly do by burning all the fossil fuels; these produced major long-term changes to Earth's biodiversity. On the time scales of human history, however, volcanoes tend to contribute more to global cooling events due to the release of aerosols: we'll get to those later this lecture.
Chemical weathering involves the breakdown of rocks by their interaction with wind, rain, groundwater, and the like.
In particular:
or
Carbon dioxide plus water plus calcium- and magenesium-silicate minerals yields dissolved calcium and magnesium ions plus bicarbonate ions plus silicic acid
Consequently, chemical weathering "scrubs" carbon dioxide from the atmosphere. The calcium bicarbonate ions may be absorbed into the ground water or taken up by living things in stream systems and lakes, but the vast majority makes its way into the oceans, where it hangs around until being taken up by the carbonate pump. Thus the atmosphere combines with the lithosphere and transports carbon via the hydrosphere into the biosphere, possibly settling down to the bottom of the ocean to become limestone (and thus part of the lithosphere!)
(If you are wondering what happens to the silic acid: that may wind up precipitating as silica from ground water, or may be taken up by diatoms or radiolarians in streams, lakes, or oceans to make their opaline shells.)
Vegetation may enter the lithosphere by being buried as medium-term storage organic material in soil in the pedosphere, or as long-sequestered coal deposits in the lithosphere. Burning of vegetation also releases carbon dioxide (and methane) back into the atmosphere.
A very important part of the interaction of plants and the atmosphere is transpiration. The waste water produced by photosynthesis is released in part as droplets or water vapor. Since the leaf-area of a tree may greatly exceed the land area directly underneath the tree, and because suction pressure and capillarity help to pull water up through the plant, the amount of water transpired by a tree can greatly exceed (up to 20 times) what would just be evaporated by the area under the tree if it wasn't there. As a net result, forests are major movers of water vapor from the pedosphere into the atmosphere, and contribute greatly to local and regional climate systems.
Non-Greenhouse Gas Natural Radiative Forcings:
Not all radiative forcings are greenhouse gases. Two additional major ones are aerosols and solar variations.
Aerosols are tiny solid particles or droplets of water with dissolved materials suspended in the atmosphere. Depending on the particular material involved, the aerosol may have increase warming or producing chilling effects. There are a huge number of different aerosol types being studied by different techniques. Due to a number of complex factors (generated mostly from point sources; short [week-long] residence times in the atmosphere; etc.), the effect of aerosols as a whole can be very difficult to model.
A particularly important aerosol variety is soot (or its more fashionable name black carbon). Because of its an extremely low albedo, it absorbs sunlight and reradiates it as IR: thus, it produces net warming. Additionally, if it lands on ice or snow, it will help to melt these surfaces.
In contrast, sulfates are extremely significant as global cooling agents. The main climatic sulfate starts as sulfur dioxide (SO2), released from burning organic material and from volcanoes. When aloft it mixes with water to form an aerosol of sulfuric acid (H2SO4). This absorbs solar radiation from above AND IR from below. If in the troposphere this produces warming over all, and does not last long (it gets scrubbed out of the atmosphere by precipitation, forming acid rain.)
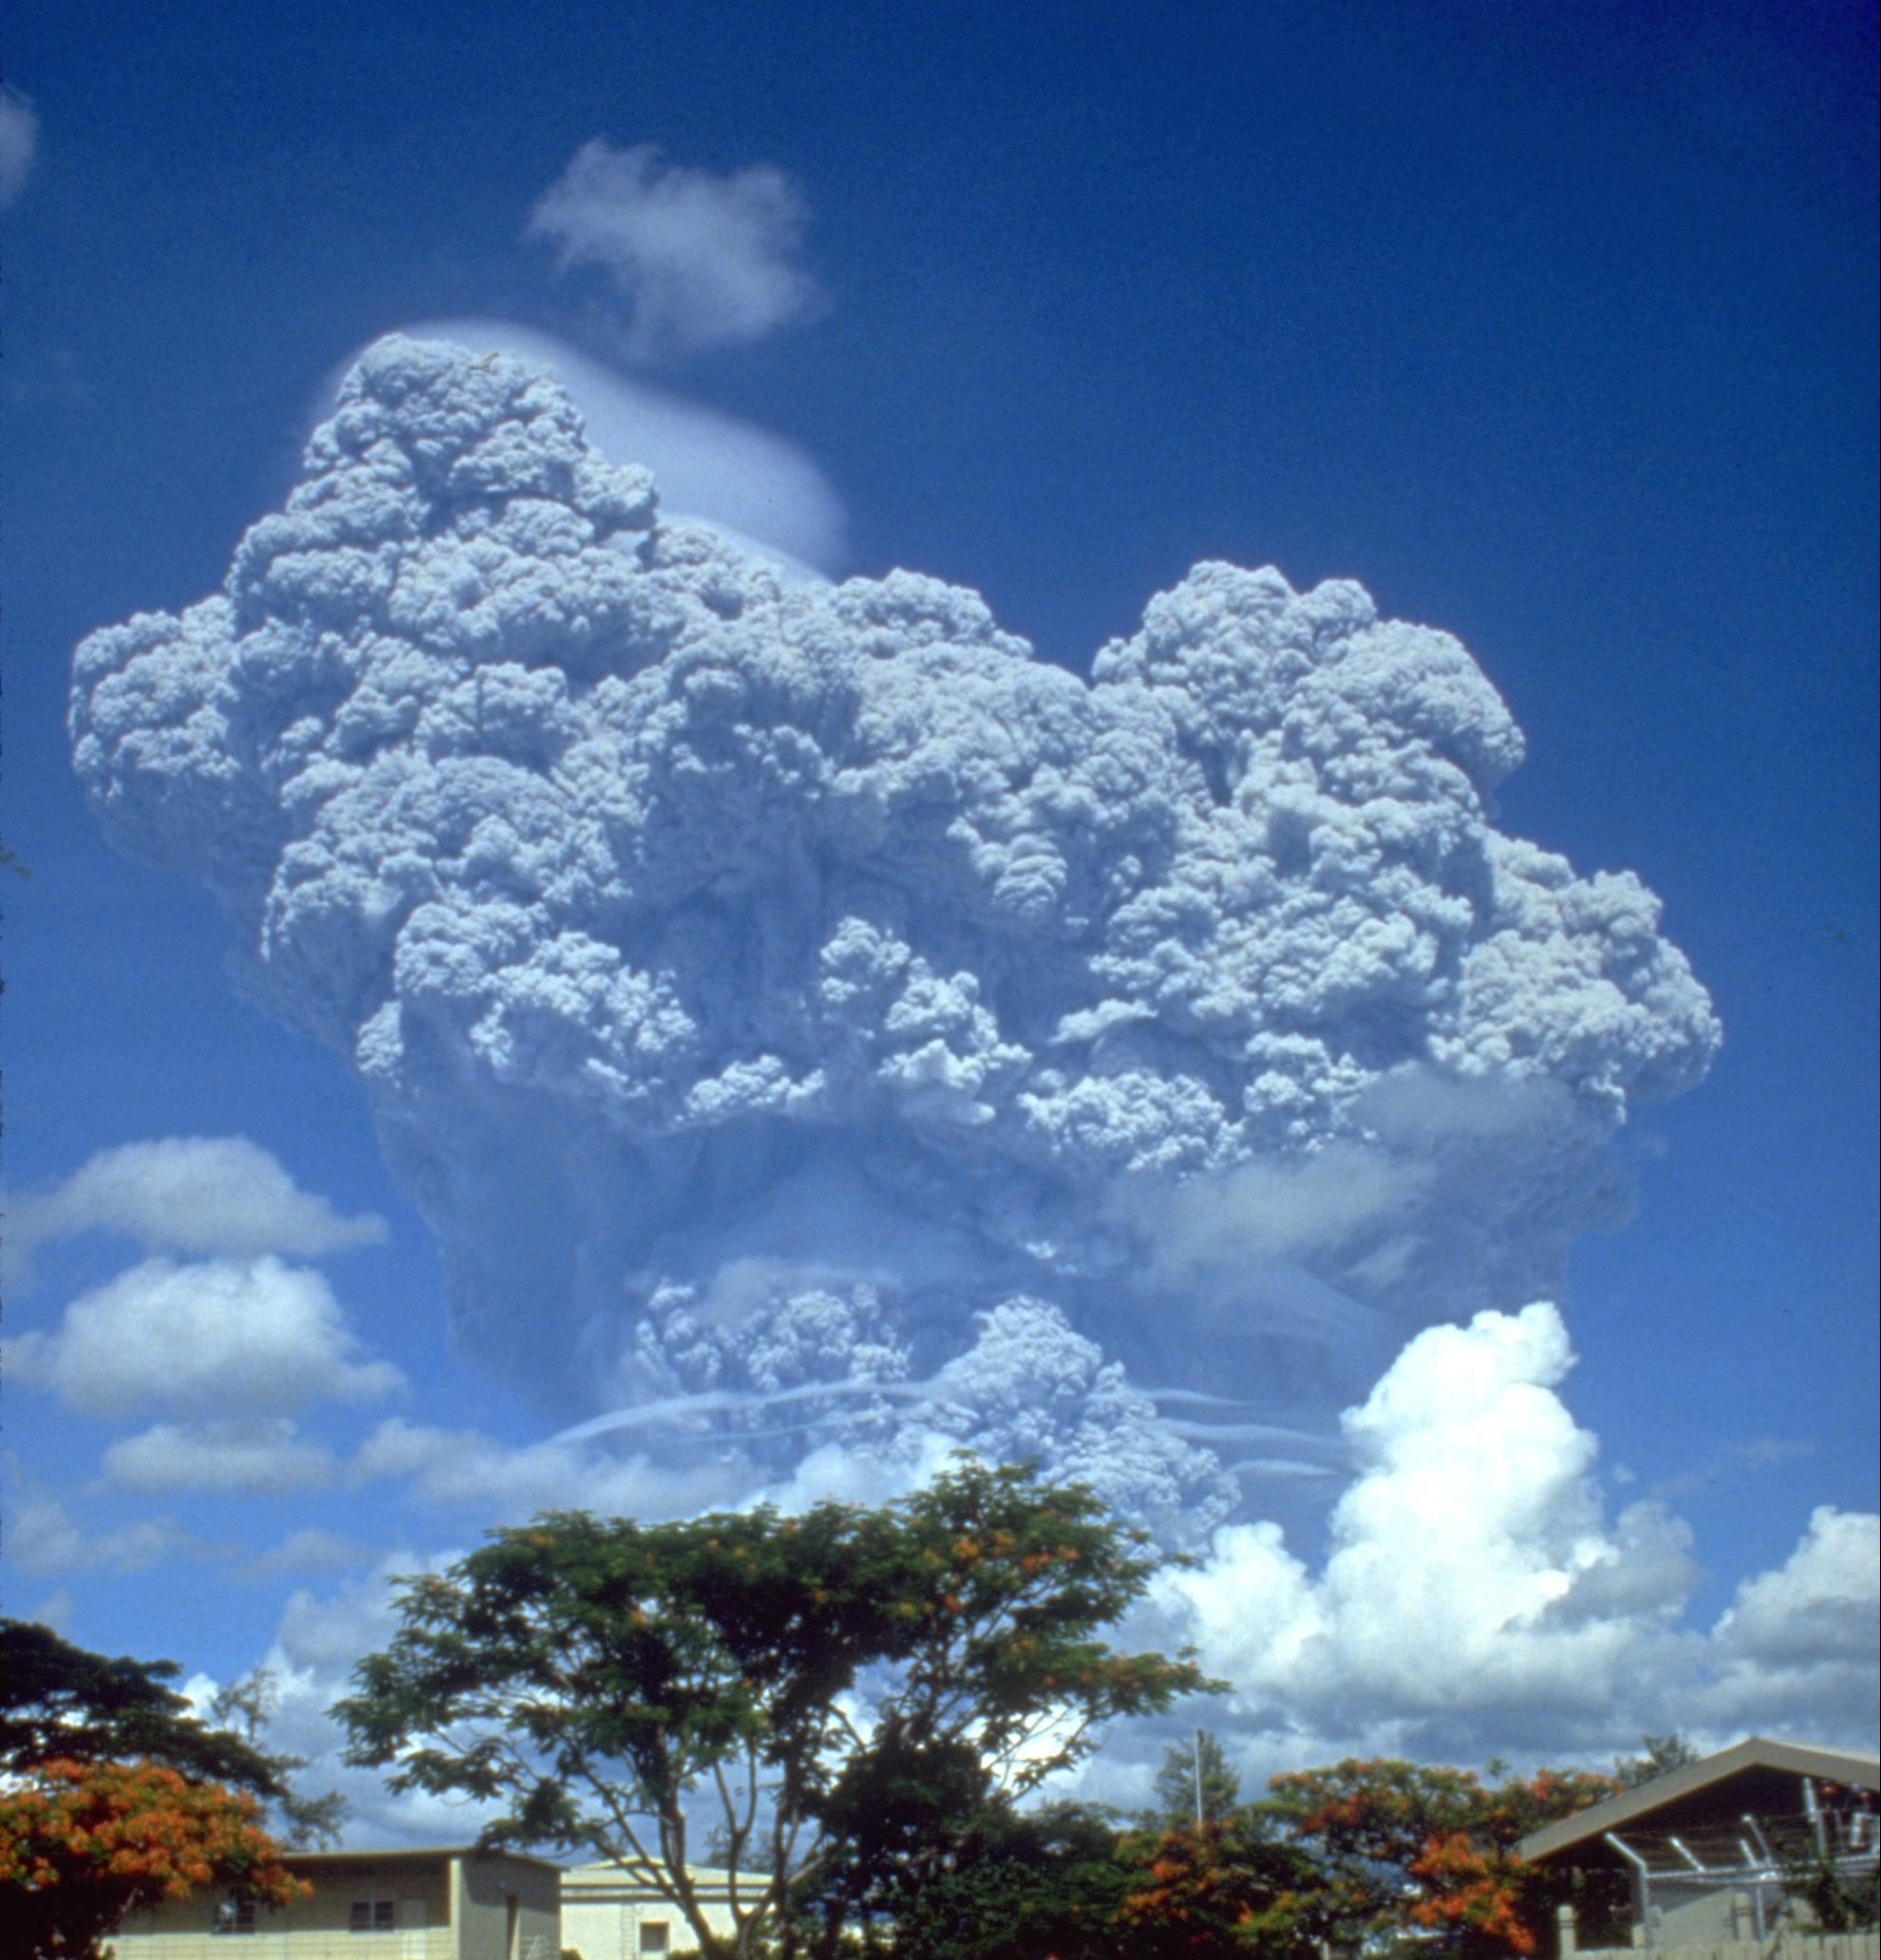
| However, volcanic eruptions can be sufficiently strong to hurl SO2 into the stratosphere. Because the
stratosphere is so dry, the sulfate aerosols can stay there for years. The wind up heating the stratosphere but (because
they are absorbing the incoming sunlight as well as some of the outgoing IR) they cool things below them. Stratospheric
sulfate aerosols will gradually spread around the world, resulting in global cooling.
Two classic examples of this:
|
|
(An aside: sulfuric acid aerosols also destroy ozone, so stratospheric sulfuric acid will result in increased UV irradiance below.)
| Another major form of non-greenhouse gas radiative forcing is changes in solar irradiance. Merck talked previously about the 11-year sunspot cycle. There are longer-term fluctuations of solar intensity which seem to be correlated with climate changes on Earth. The Maunder Minimum of the late 17th Century and the Dalton Minimum of the end of the 18th and early 19th Centuries were periods of unusual cold and unusually low amounts of observed sunspot activity. Some speculate that the Medieval Warm Period (c. 850 to 1200 C.E.) may have been a comparable period of higher activity, but we lack the observations to test this. No climatologist denies that solar activity is a contributor of global climate change, but it is by no means the entire situation. For instance, despite the increasing temperatures of the last few decades, we are in a period of decreasing solar activity (see figure right below: TSI = total solar irradiance). |
 
|
ENSO and Climate:
| Last week Merck introduced ENSO (the El Niño Southern Oscillation). A consequence of ENSO is shifts in global temperatures independent of other forcings. In general (as seen on the plot right), intense El Niño episodes (the upwards red on the lowermost curve) show higher global temperatures, while strong La Niña episodes (the downwards blue) show globally cooler temperatures. |

|
So Earth's climate--even on a relatively short timescale--involves many different factors independent of human effects. So how exactly do humans contribute to this system?
Anthropogenic Radiative Forcings:
| The most obvious contribution of humans is in the form of greenhouse gas release. Some is methane (from garbage dumps, rice paddies, cattle, and so forth); some is carbon dioxide from the generation of cement; some is carbon dioxide released from deforestation (both the burning of the wood and the lack of that potential sink for carbon); and especially from the burning of fossil fuels. Not all the emitted carbon dioxide remains in the atmosphere (compare the emissions to the observed in the diagram to the left): in fact, on average only about 46% of it remains directly as atmospheric CO2. The rest gets incorporated into vegetation or dissolved into the shallow seas (hardly a surprise, given the flux rate of these two systems: see above.) |

|
However, humans have additional climate effects. Among these are:
- Generation of black carbon (soot)
- Generation of sulfate aerosols
- Change in regional albedo due to land use changes
- Change in regional transpiration due to replacement of forests by farms (or vice versa)
- And others we will see later
| Putting it together, we can see in the chart to the right that global temperatures tend to increase over time on average, but ENSO (the middle part) and episodes of sulfate increase from volcanoes (the bottom part) result in modifications of the basic pattern. Also, looking at the instrumental record near the top of the page, the period of temperature stability in the mid-20th Century is likely due to the introduction of a lot of industrial aerosols due to post-WWII economic growth. The rise of clean air legislation to remove these pollutants in the 1970s and 1980s removed their chilling effect, and let the rising greenhouse gases do their work. (No good turn goes unpunished...) |

|
Knowing the relative effects of different natural causes, we can subtract them from instrumentally-observed temperature
change and reveal the human contribution:
Climate Inertia:
A final note: just as a kettle on a stove doesn't instantly reach boiling, so too changes in climate systems
take time to reach equilibrium states. Estimates are that even after 25-50 years only 60% of the equilibrium
temperature will be reached. Consequently, had we stopped adding greenhouse gases in 2003 (which, obviously, we
didn't) we would still get another additional 0.6K increase over the next several decades.
The Lecture, Summarized as a Youtube Video:

