Life is organized as a pattern of a tree, with lineages diverging from common ancestors.
Over time, the lineages acquire new adaptations that are passed on (sometimes with modification) to their descendants.
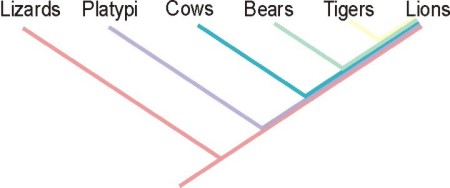
Example:
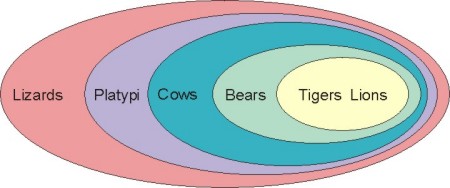
Or by a braching diagram:
In 1950s, German entomologist Willi Hennig realized that one could use this method to organize taxonomy (systematics) by reconstructing the phylogeny (family tree) of life.
The branching diagram above is called a cladogram.
Here is another, more comprehensive, cladogram of living terrestrial vertebrates:
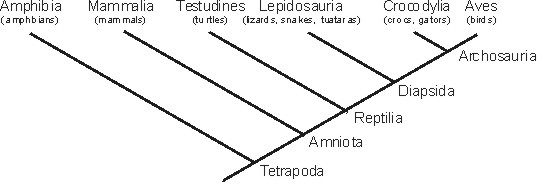
The taxa along the top line are terminal taxa
Nodes:
In the above example, Amphibia, Mammalia, Testudines, Lepidosauria, Crocodylia, and Aves are all terminal taxa; Tetrapoda, Amniota, Reptilia, Diapsida, and Archosauria are named nodes.
Each node contains ALL taxa further up the tree!
The above arrangement can also be written in outline form:
Tetrapoda
So:
Two taxa which meet at a node are called sister taxa, and are each other's closest relatives (i.e., they represent the two lineages which diverged from that particular common ancestor).
So:
The ingroup represents the assemblage of taxa of primary interest in any particular study; the outgroup is the sister taxon to the ingroup.
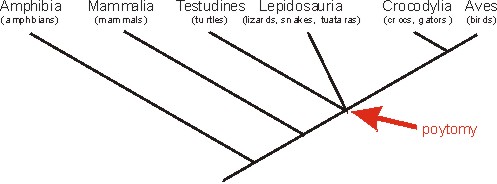
Sometimes the relationship between three or more terminal taxa is uncertain. These are drawn as polytomies: multiple branches stemming from the same node.
For example, some evidence suggests that, unlike the cladogram above, turtles might be
closer to lepidosaurs than lepidosaurs are to archosaurs, or that turtles might be closer
to archosaurs than archosaurs are to lepidosaurs. This uncertainty can be shown by the
following polytomy:
To Next Lecture.
To Previous Lecture.
To Syllabus.