Laboratory Research

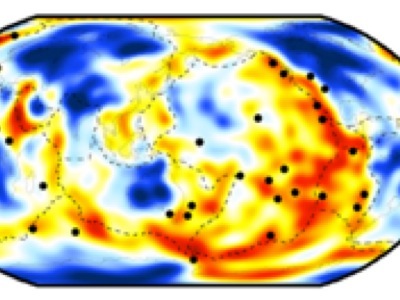
Full waveform tomography with the spectral element method

Map of lateral variations in the velocity of seismic shear waves (S-waves) at a depth of 125 km. Warm colors denote slower wavespeeds, and are thought to indicate warmer temperatures and/or the presence of melt or water. Cool colors denote faster wavespeeds, and indicate cool regions, such as the mantle beneath the ancient, stable portions

Full waveform tomography with the spectral element method Read More »

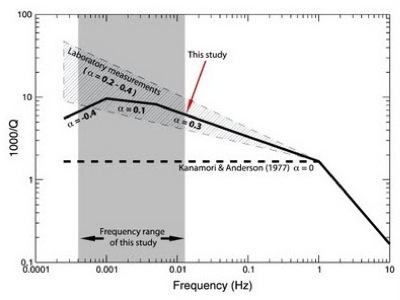
Frequency dependence of seismic attenuation

Preferred model (solid line) of frequency dependence of attenuation within the absorption band compared with constraints from laboratory studies (hachured region) and the frequency-independent assumption (dashed line). In our model, α is approximately 0.3 at periods shorter than 200 s, decreasing to 0.1 in the period range 300–800 s, and becoming negative (−0.4) at periods longer than

Frequency dependence of seismic attenuation Read More »

Scroll to Top