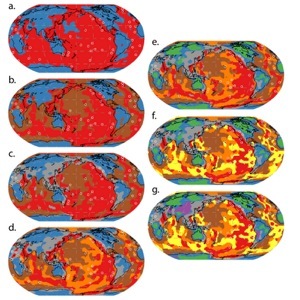
Cluster analysis of upper mantle tomography
When cluster analysis is used to classify the profiles of shear velocity (Vs) into N groups whose members are similar, the geographic extents of these groups mirrors the surface expression of tectonics. When N = 2 (panel a), one cluster corresponds to oceanic regions and the other to continental …
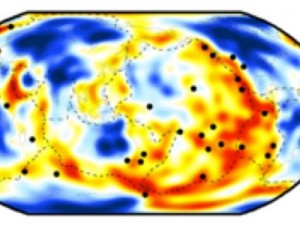
Full waveform tomography with the spectral element method
Map of lateral variations in the velocity of seismic shear waves (S-waves) at a depth of 125 km. Warm colors denote slower wavespeeds, and are thought to indicate warmer temperatures and/or the presence of melt or water. Cool colors denote faster wavespeeds, and indicate cool regions, such as the …
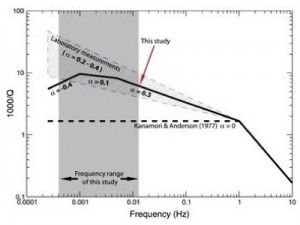
Frequency dependence of seismic attenuation
Preferred model (solid line) of frequency dependence of attenuation within the absorption band compared with constraints from laboratory studies (hachured region) and the frequency-independent assumption (dashed line). In our model, α is approximately 0.3 at periods shorter than 200 s, decreasing …
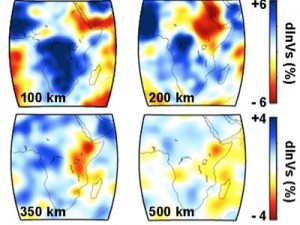
Lithospheric structure beneath continental rifts
Isotropic shear wavespeed variations in the upper mantle from the SEMum model [Lekic and Romanowicz, 2008]. The model is developed using the spectral element method to perform full waveform modeling. Note the structural complexity in the uppermost 100-200 km which must be corrected for in order to …