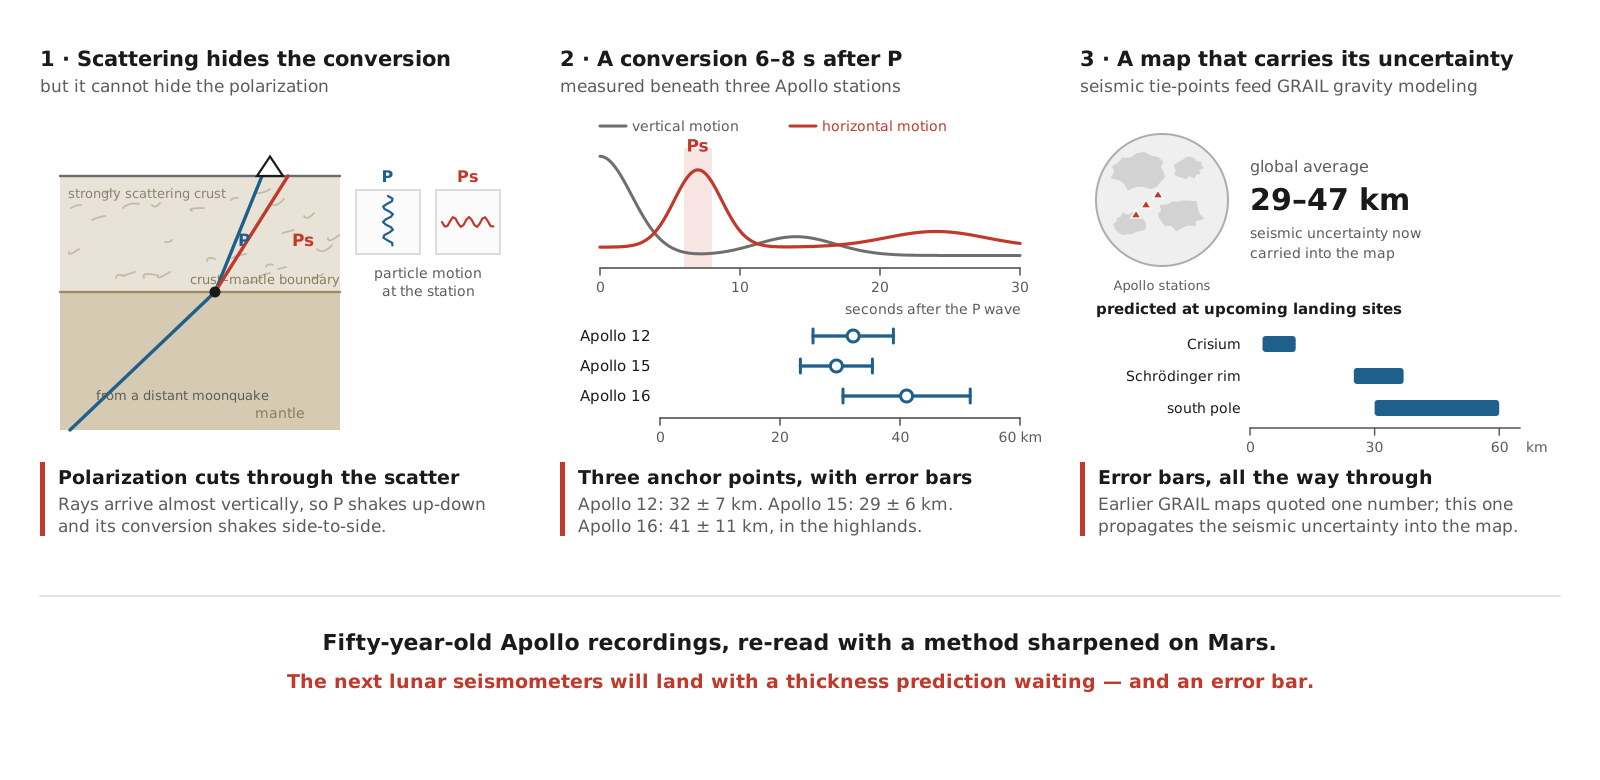
On Earth, a straightforward way of measuring the thickness of the crust beneath a seismometer is to look for converted waves — a P wave that turns into an S wave at the crust-mantle boundary. The method is simple, reliable, and used everywhere. On the Moon it has never really worked for P-to-S conversions. Apollo seismograms are so thoroughly scattered that the conversions are buried, and until now only S-to-P conversions had been identified in lunar data at all. Doyeon Kim, formerly of this lab and now at Imperial College London, has found them, allowing us to make new crustal thickness estimates beneath three Apollo stations, which anchor a new global map of the Moon’s crust.
Billions of years of impacts have pulverized the shallow lunar layers into a fractured, heterogeneous layer called the megaregolith. It scatters seismic energy strongly, smearing every arrival into a long ringing coda that can last an hour. Receiver functions, which extract conversions by deconvolving the incoming wave from the record, need a reasonably clean waveform to work with, and previous attempts on lunar data have foundered on unstable deconvolution.
The way around it is to try to extract waves that have not been strongly scattered and analyze those instead. Because the megaregolith is so slow, a seismic ray coming from the deep interior bends upward until it hits the surface almost vertically. That means a P wave shakes the ground up and down, and an S wave shakes it side to side, and both do so along a straight line (to first order). Scattered energy is different, arriving from every direction at once, and having a particle motion that is far from linear. So, a converted phase announces itself not by being large, but by being rectilinear, and by being polarized in the direction opposite to the wave that produced it. Frequency-dependent polarization analysis tracks exactly this, decomposing the three-component record in time and frequency and asking, at each point, how well organized the particle motion is and which way it points.
That machinery came from Mars. It is the same approach used to pull ScS out of InSight’s waveforms, to find the core-transiting SKS phases we wrote about here a couple of years ago (Irving et al., 2023, PNAS), and to track Rayleigh waves orbiting the planet (Kim et al., 2022, 2023). Working with a single noisy station on Mars taught us lessons that we can now apply to Apollo lunar records made fifty years earlier.
Just to be sure, we validated the approach on synthetic waveforms. Three-dimensional wave propagation was run through a crust with 15% velocity and density heterogeneity at a 750 m correlation length — values matched to what the SIVB booster impacts imply for the real lunar crust — and the conversion from a 39 km deep boundary remained clearly detectable in the polarization attributes despite the mess in the waveform. Reassuringly, late-arriving scattered energy did not corrupt the polarization of earlier arrivals.
Applied to 28 shallow moonquakes and five artificial impacts, the analysis identified 12 events with clear direct P or S polarization at Apollo 12, 15, and 16. A signal with horizontal rectilinear motion appears consistently 6 to 8 seconds after the direct P wave at Apollo 12 and 16, corresponding to a P-to-S conversion across a boundary at 30-40 km depth. Apollo 16 also shows an arrival near 14 seconds that looks like a reflection off the same boundary, and the S-wave records at Apollo 12 carry both a multiple and a crustal reflection. A grid search over thickness, shear velocity, and Vp/Vs yields crustal thickness estimates of 32 ± 7 km beneath Apollo 12, 29 ± 6 km beneath Apollo 15, and 41 ± 11 km beneath Apollo 16.
Those three numbers then become tie-points for gravimetric modeling of GRAIL data. Earlier global maps were anchored at Apollo 12 using a single seismic thickness, with no accounting for how uncertain that thickness estimate was. However, different choices of anchor values produced two different global averages, 34 and 43 km, with no way to say how much confidence to place in either. Propagating the seismic uncertainties explicitly gives a global average crustal thickness of 29 to 47 km. Adding the second and third tie-points barely changes the answer, which is a good sign for a network confined to one small patch of the nearside. Instead, the global average depends strongly on the density contrast between crust and mantle.
We then venture into making some predictions. Beneath the Lunar Geophysical Network’s candidate sites the model gives crustal thicknesses of 22-28 km in the Procellarum KREEP Terrane and, strikingly, only 3-11 km at Crisium. At the rim of Schrödinger basin, where NASA’s Farside Seismic Suite is headed, it predicts 25-37 km. Across the sites where Artemis IV astronauts may deploy the Lunar Environment Monitoring Station, 30-60 km. The next generation of lunar seismometers will therefore directly test predictions of our lunar crustal thickness models.
You can read the paper here: A New Lunar Crustal Thickness Model Constrained by Converted Seismic Waves Detected Beneath the Apollo Seismic Network | Geophysical Research Letters